
The ESG Operating System: Why Annual Sustainability Reports Are Becoming Obsolete
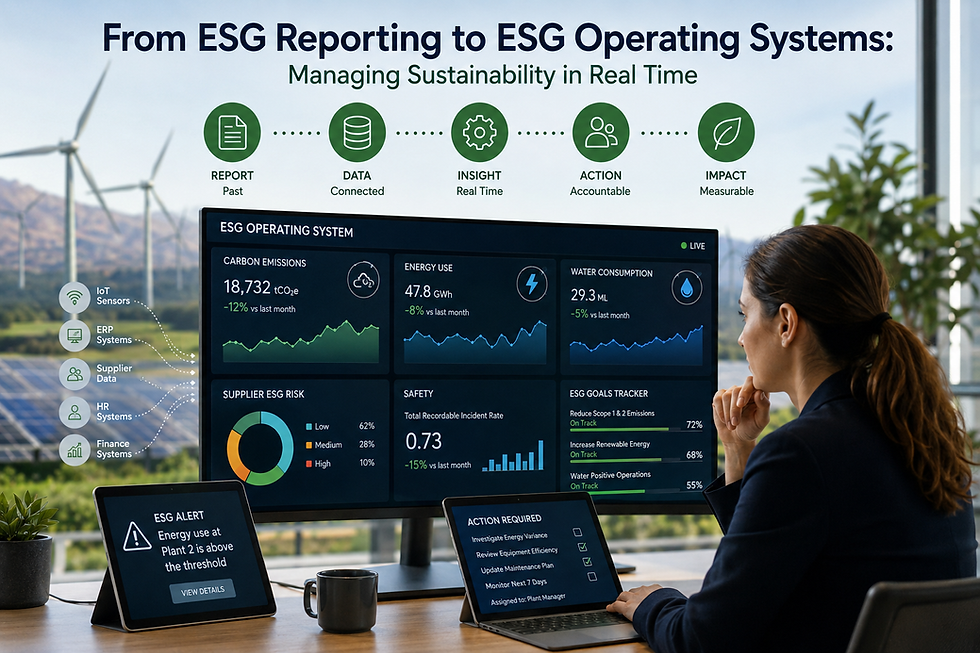
For years, corporate sustainability followed a predictable routine: collect environmental, social and governance data at the end of the year, consolidate hundreds of spreadsheets, obtain management approval and publish a polished ESG report several months later.
That approach may satisfy a disclosure requirement, but it does not necessarily improve business performance.
A sustainability report tells stakeholders what happened in the past. An ESG operating system helps managers decide what should happen next.
The next phase of ESG will therefore not be defined by longer reports. It will be defined by connected data, real-time alerts, accountable decision-makers and sustainability indicators embedded within everyday business processes.
This shift is already being driven by stronger reporting expectations. The International Sustainability Standards Board’s IFRS S1 and IFRS S2 standards provide a global baseline for investor-focused sustainability and climate disclosures. Their emphasis on decision-useful information strengthens the need for reliable, comparable and well-governed corporate data.
Why Traditional ESG Reporting Is No Longer Enough
Annual ESG reporting usually begins after the activity being measured has already occurred.
Electricity has been consumed. Water has been withdrawn. Waste has been generated. Suppliers have been selected. Employee incidents have happened. Capital has been allocated.
By the time the figures reach the sustainability team, opportunities to intervene may have disappeared.
Consider a manufacturing company that receives its energy data three months after the reporting period. The company might eventually discover that one plant is consuming significantly more energy per unit of production than comparable facilities. But it has already paid the additional energy cost and generated the associated emissions.
A real-time ESG system would detect the abnormality within days—or potentially hours—and alert the plant manager.
That is the fundamental difference:
Traditional ESG reporting records performance. An ESG operating system actively manages it.
The market is recognising the need for better digital infrastructure. Deloitte estimated that ESG reporting software revenue would rise from below US$800 million in 2023 to more than US$1 billion in 2024, with forecasts indicating annual growth rates of approximately 19% to 30% over the following years.
Estimated global ESG reporting software revenue
Deloitte’s estimate illustrates the accelerating investment in digital ESG reporting infrastructure.

Source: Deloitte technology predictions. Figures are approximate.
However, buying software alone does not create an operating system. Technology must be accompanied by data ownership, governance, controls and action protocols.
What Is an ESG Operating System?
An ESG operating system is the combination of people, processes, technologies and controls that continuously converts sustainability data into business decisions.
It can connect information from:
Utility meters and building-management systems
Enterprise resource planning platforms
Procurement and supplier portals
Human-resources systems
Travel and logistics platforms
Safety and incident-management tools
Financial planning and risk-management systems
Instead of maintaining ESG as a separate reporting exercise, the company creates a common data layer through which sustainability indicators are reviewed alongside cost, production, quality and risk.
For example, a procurement manager evaluating two suppliers would not see only price and delivery time. The decision screen could also show emissions intensity, water exposure, labour-risk indicators and the percentage of recycled content.
Similarly, a chief financial officer approving a capital project could see its expected return, energy savings, carbon impact and exposure to future carbon costs.
This integration is becoming increasingly important to finance functions. One reported benchmark found that CFOs held primary responsibility for sustainability reporting in 32% of surveyed organisations, compared with 16% where the chief sustainability officer had primary responsibility. The same analysis highlighted persistent gaps in ESG data and analytical capabilities.
Primary responsibility for sustainability reporting

Source: Deloitte ESG benchmark as reported in CFO Journal.
The Five-Step Roadmap
Step 1: Identify Decisions, Not Just Disclosures
Companies often begin by creating a list of indicators required by GRI, BRSR, ISSB, ESRS or another reporting framework.
An operating-system approach starts with a different question:
Which business decisions should ESG data improve?
These could include selecting suppliers, scheduling production, approving travel, designing products, managing buildings or allocating capital.
Choose five to ten high-impact decisions and identify the sustainability information required to improve each one.
Step 2: Map the Existing Data
Most organisations already possess much of the required information. The challenge is that it is dispersed across invoices, spreadsheets, meters, procurement systems and departmental databases.
Create a data map showing:
The source of each indicator
The data owner
Collection frequency
Calculation methodology
Current quality level
Evidence required for assurance
This exercise frequently reveals duplicate data collection, conflicting definitions and indicators with no clear owner.
Assurance readiness is becoming particularly important. KPMG’s 2025 ESG Assurance Maturity Index examined 1,320 companies, reflecting how organisations are strengthening their systems as sustainability information becomes more closely connected to corporate reporting and assurance.
Step 3: Connect and Automate Priority Indicators
Do not attempt to automate every ESG indicator immediately.
Begin with metrics that are measurable, operationally relevant and collected frequently. Strong starting points include electricity, fuel, water, waste, safety incidents, employee turnover and supplier assessments.
Data can be transferred through application programming interfaces, smart meters, automated invoice extraction or scheduled system integrations.
The objective is not merely to display more data. It is to reduce manual handling, establish traceability and make information available quickly enough to support action.
Step 4: Create Alerts and Decision Protocols
A dashboard without accountability is simply a more attractive report.
Every priority indicator should have:
A target
A tolerance range
A named owner
An escalation trigger
A predefined response
For example, when a facility exceeds its energy-intensity threshold by 10%, the system could alert the plant manager, facilities team and sustainability lead. The owner would then investigate equipment efficiency, operating hours, production changes or data errors.
This converts sustainability from passive observation into active management.
Step 5: Build Governance and Human Oversight
Artificial intelligence can increasingly help classify ESG information, compare reports, identify anomalies and update knowledge bases. Recent research proposes agent-based ESG systems that support identification, measurement, reporting, engagement and continuous improvement.
But automation must not eliminate human accountability.
Companies need controls for data validation, calculation changes, access permissions, audit trails and AI-generated conclusions. Sustainability, finance, risk, technology, procurement and internal-audit teams should jointly govern the system.
A Practical ESG Operating-System Dashboard
A useful executive dashboard should avoid displaying hundreds of indicators. It should focus on metrics linked to material business decisions.
Business area | Real-time or frequent indicator | Possible action |
Operations | Energy per unit produced | Investigate inefficient machinery |
Procurement | Supplier emissions intensity | Engage or replace high-risk suppliers |
Facilities | Water consumption variance | Detect leaks or process inefficiency |
Human resources | Attrition and safety trends | Review workload and workplace conditions |
Finance | Internal carbon cost | Reprioritise capital expenditure |
Logistics | Emissions per delivery | Optimise routes and vehicle utilisation |
The dashboard should allow users to move from a group-level indicator to the responsible facility, department, supplier or process. Without this level of detail, managers may understand that performance is deteriorating but remain unable to identify its cause.
From Compliance Cost to Competitive Intelligence
The real value of an ESG operating system is not faster report production.
It is the ability to detect waste, compare facilities, anticipate regulatory exposure, improve supplier performance and identify lower-carbon products before competitors do.
Deloitte’s 2025 global C-suite sustainability survey found that 83% of respondents had increased sustainability investment during the preceding year, indicating that sustainability remained a significant management priority despite economic and political uncertainty.
Companies that continue treating ESG as an annual publication may meet minimum disclosure requirements. Companies that build ESG operating systems can use the same information to reduce costs, strengthen resilience and create new business value.
The future of sustainability management will not be a thicker report.
It will be a live organisational capability—measuring what matters, alerting the right people and improving decisions every day.


Comments